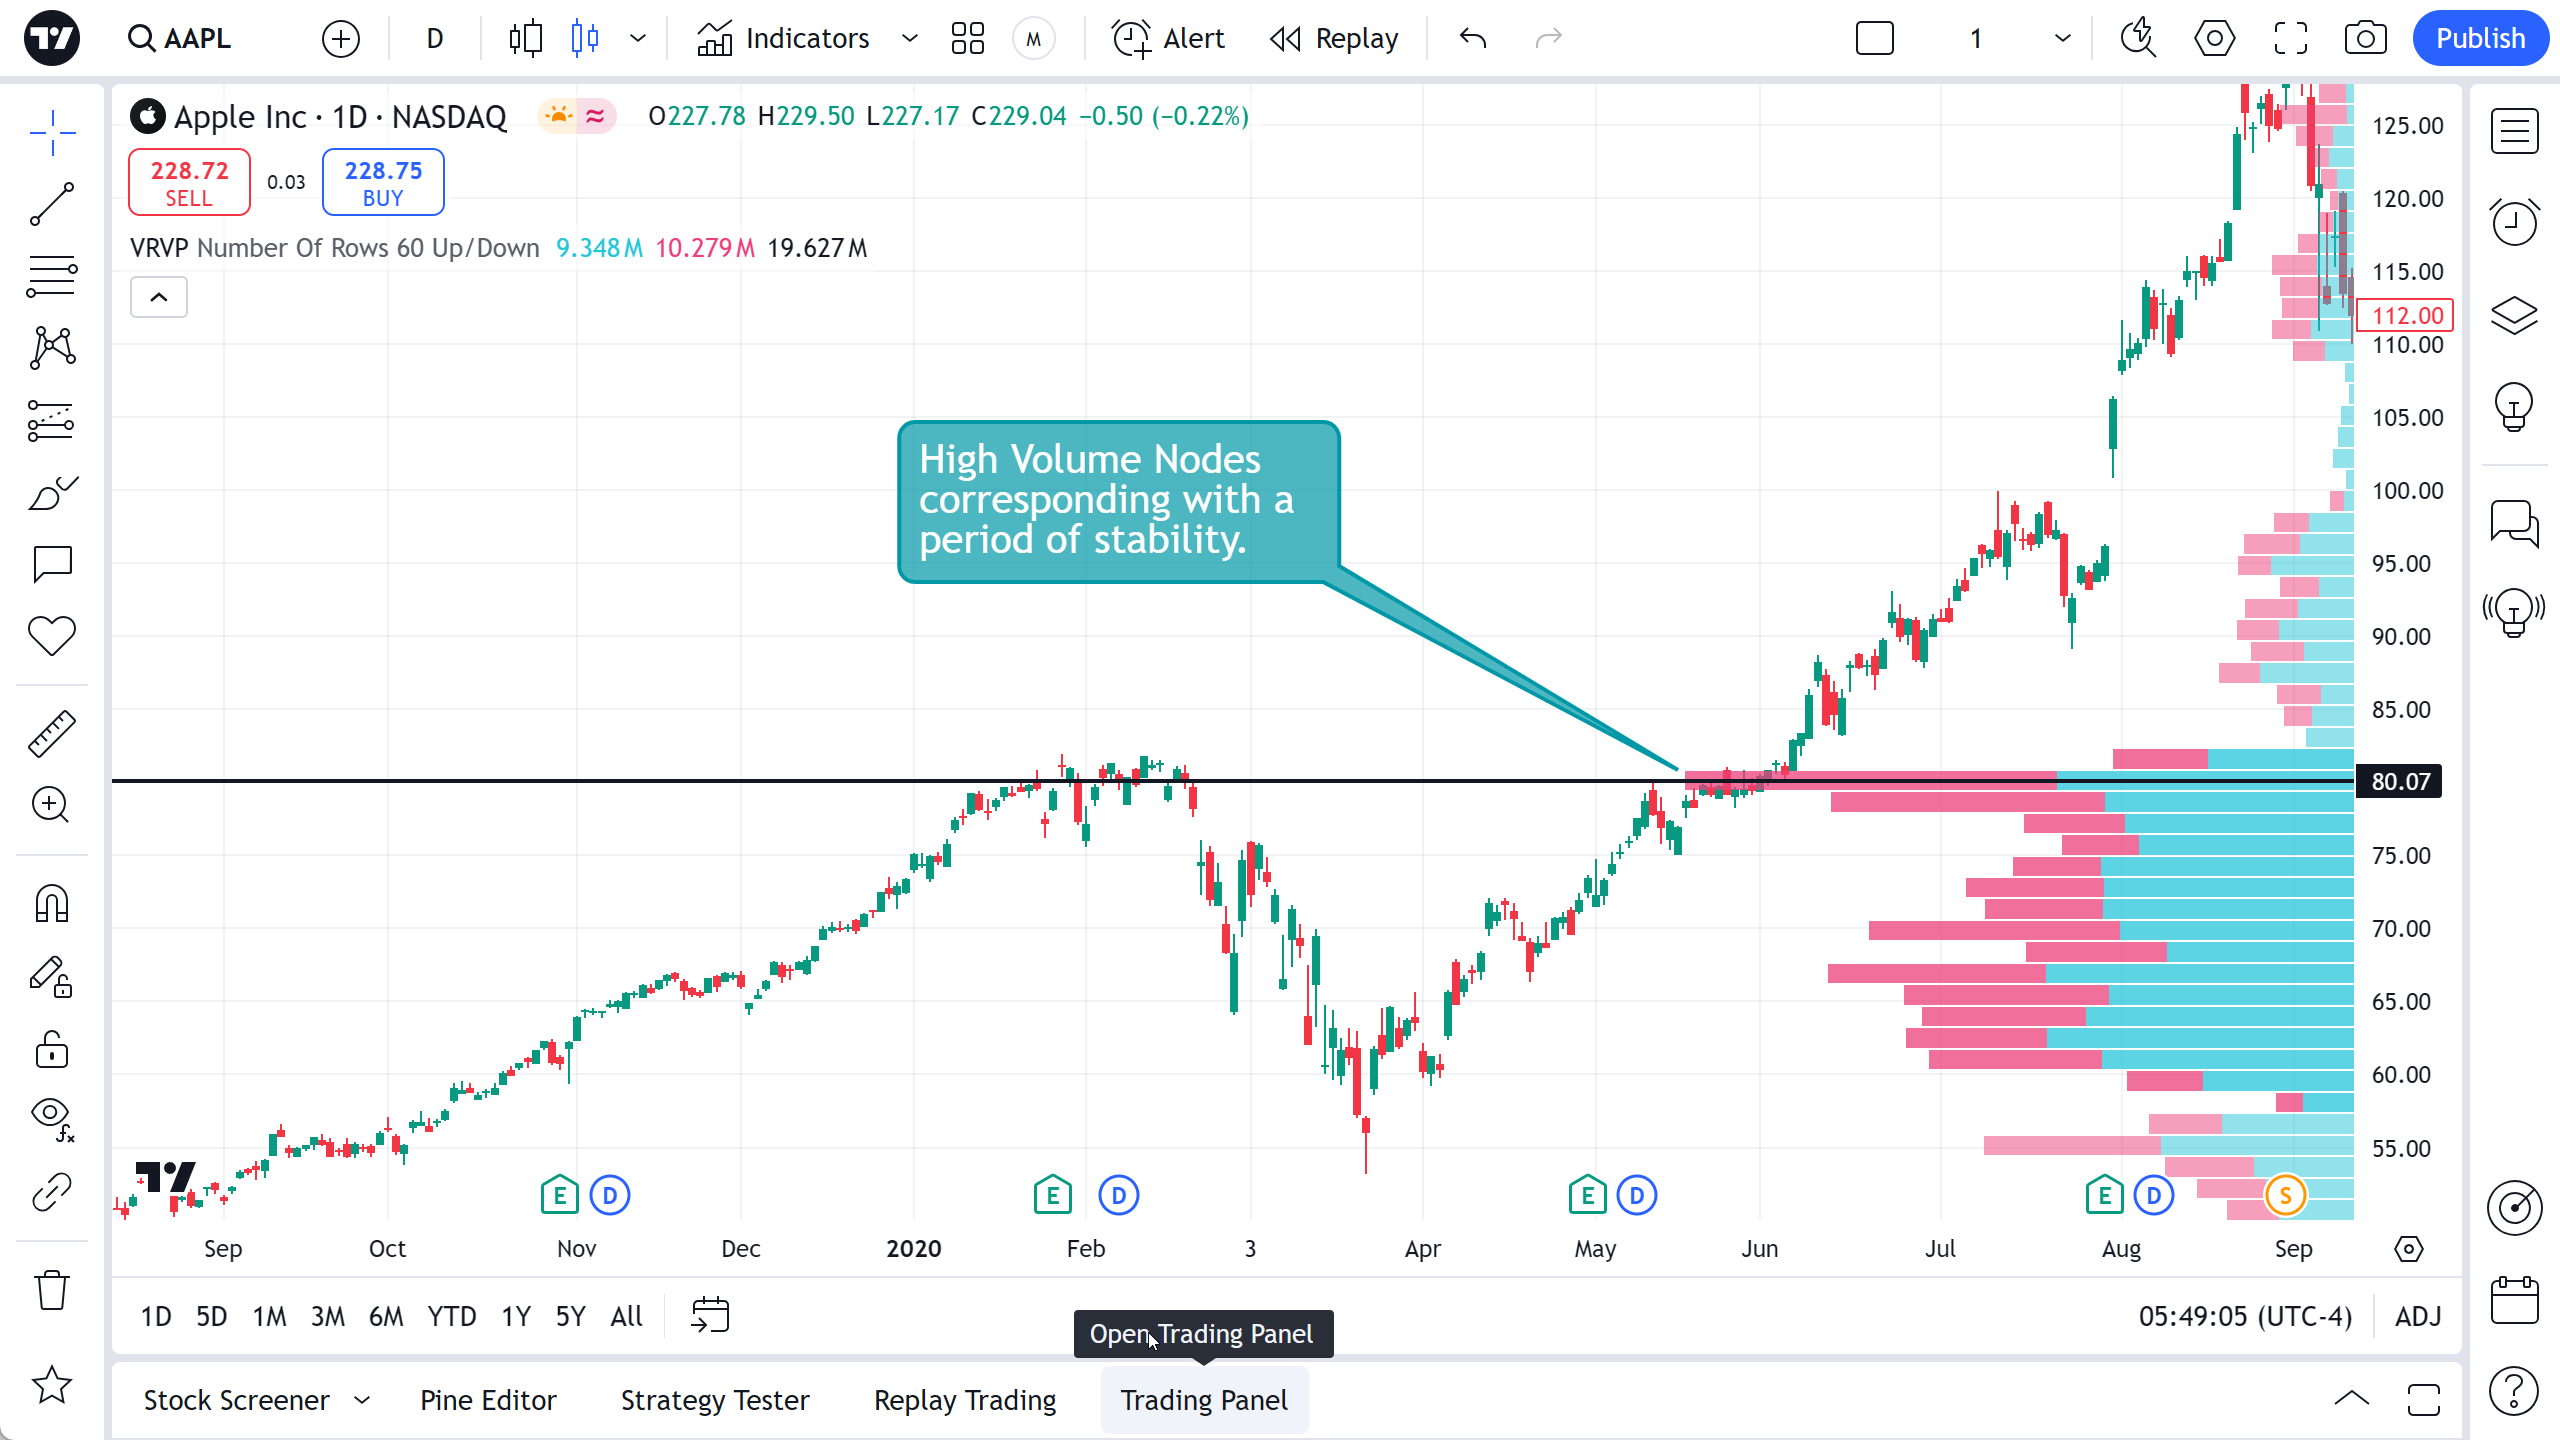
VRVP Indicator in Stock Chart
Explanation: https://x.com/Tradewrite/status/1885876235923841352?s=19
It showcases the sum of volumes from each candles, that appear on the screen visually, sums sell volume and buy volume separately and makes a relative histograms from these numbers.
Please authenticate to join the conversation.
Upvoters
Status
Planned
Board
💡
Feature Request
Tags
Visualizer
Date
Over 1 year ago
Author

Tradevision Husky
Subscribe to post
Get notified by email when there are changes.
Upvoters
Status
Planned
Board
💡
Feature Request
Tags
Visualizer
Date
Over 1 year ago
Author
Tradevision Husky
Subscribe to post
Get notified by email when there are changes.